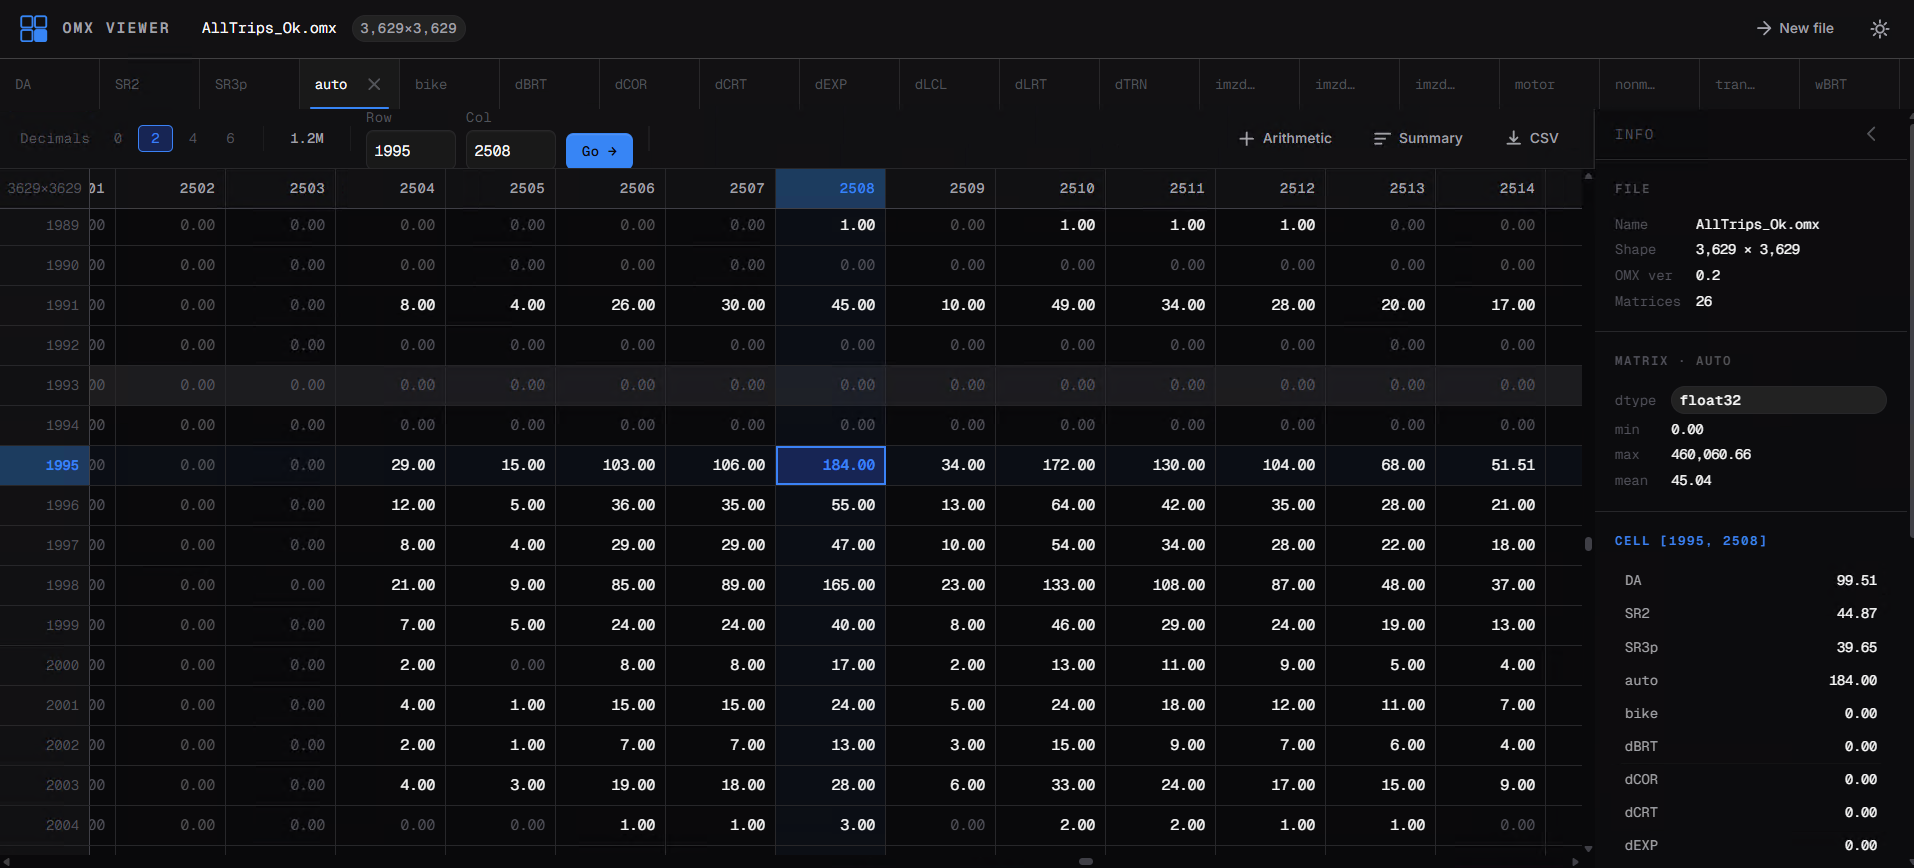
Building a Client-Side Open Matrix (OMX) File Viewer
JavaScript
WebAssembly
OMX
Travel Demand Modeling
Open Source

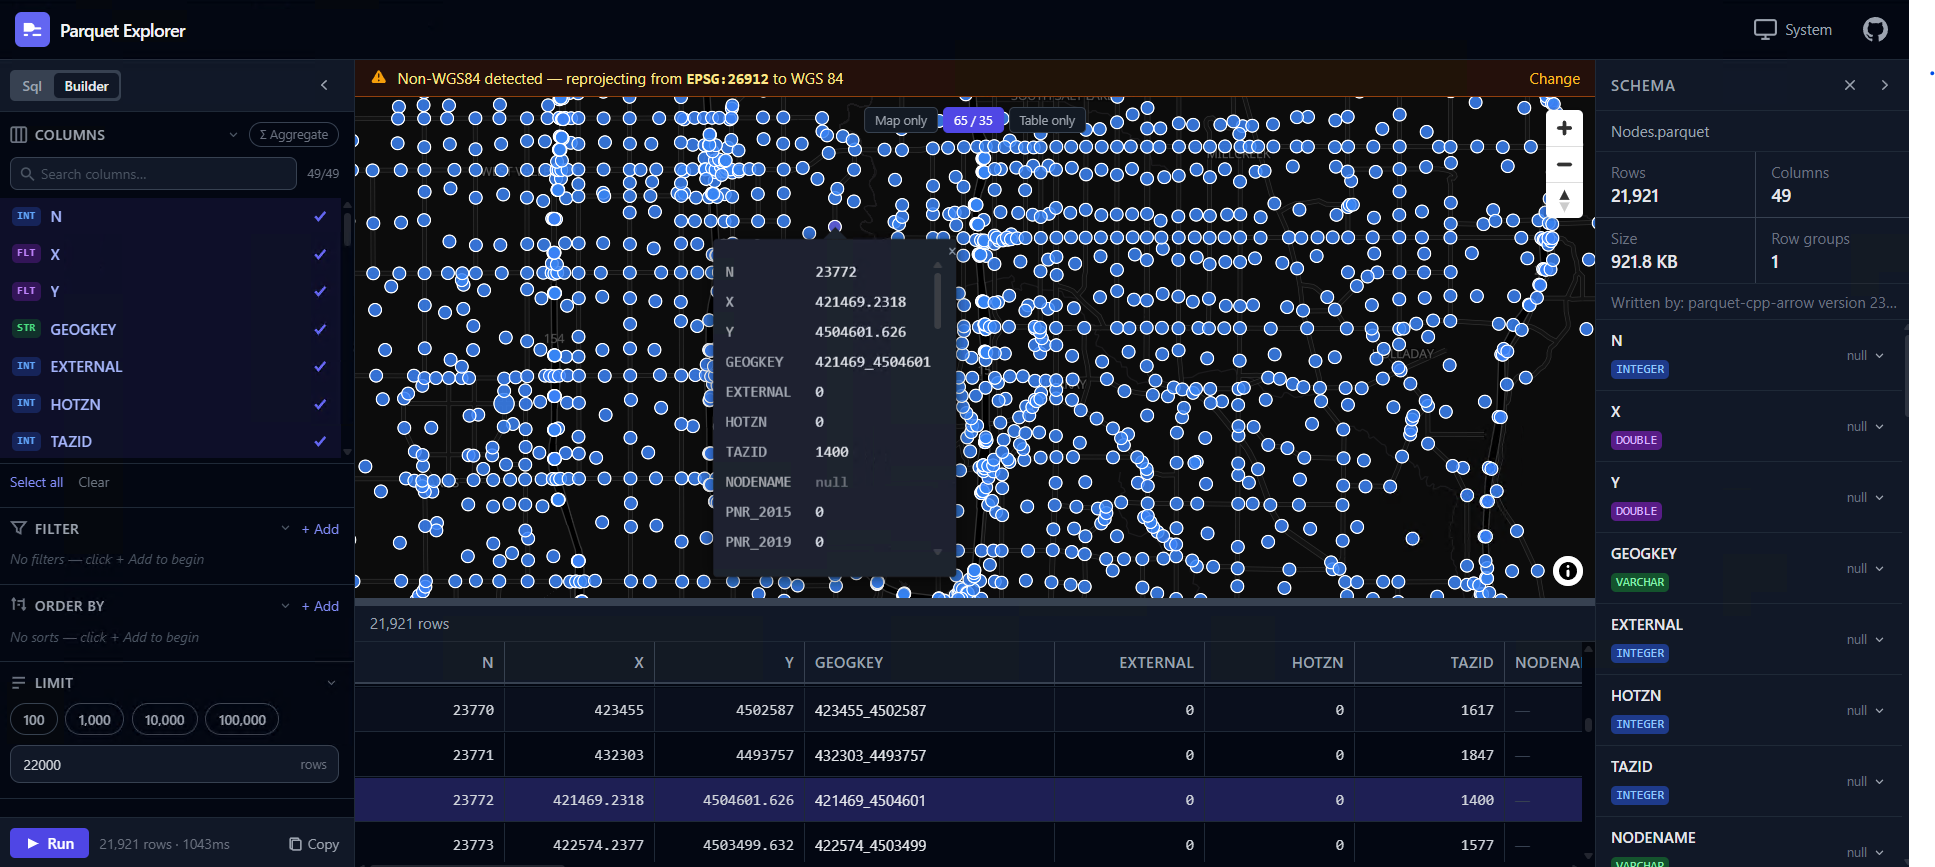
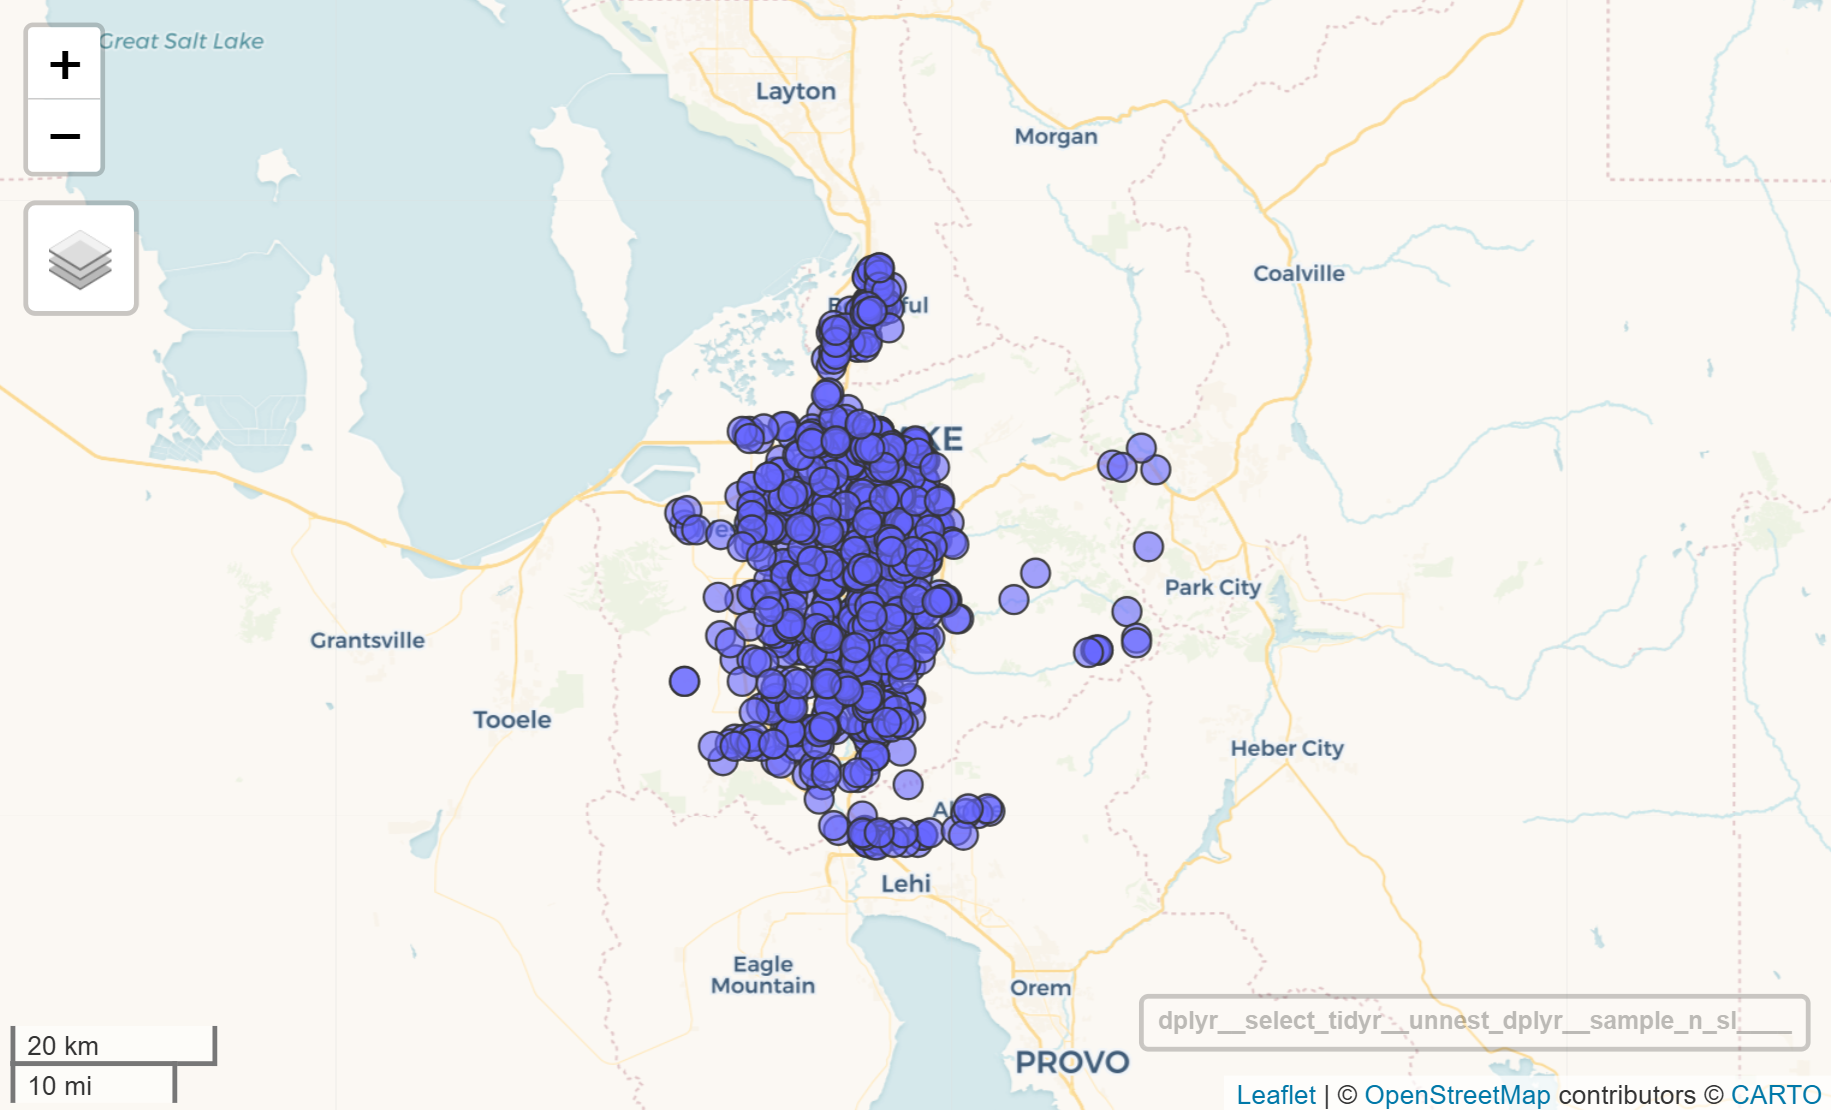
Building a Client-Side Spatial SQL Explorer
JavaScript
GIS
DuckDB
WebAssembly
Open Source

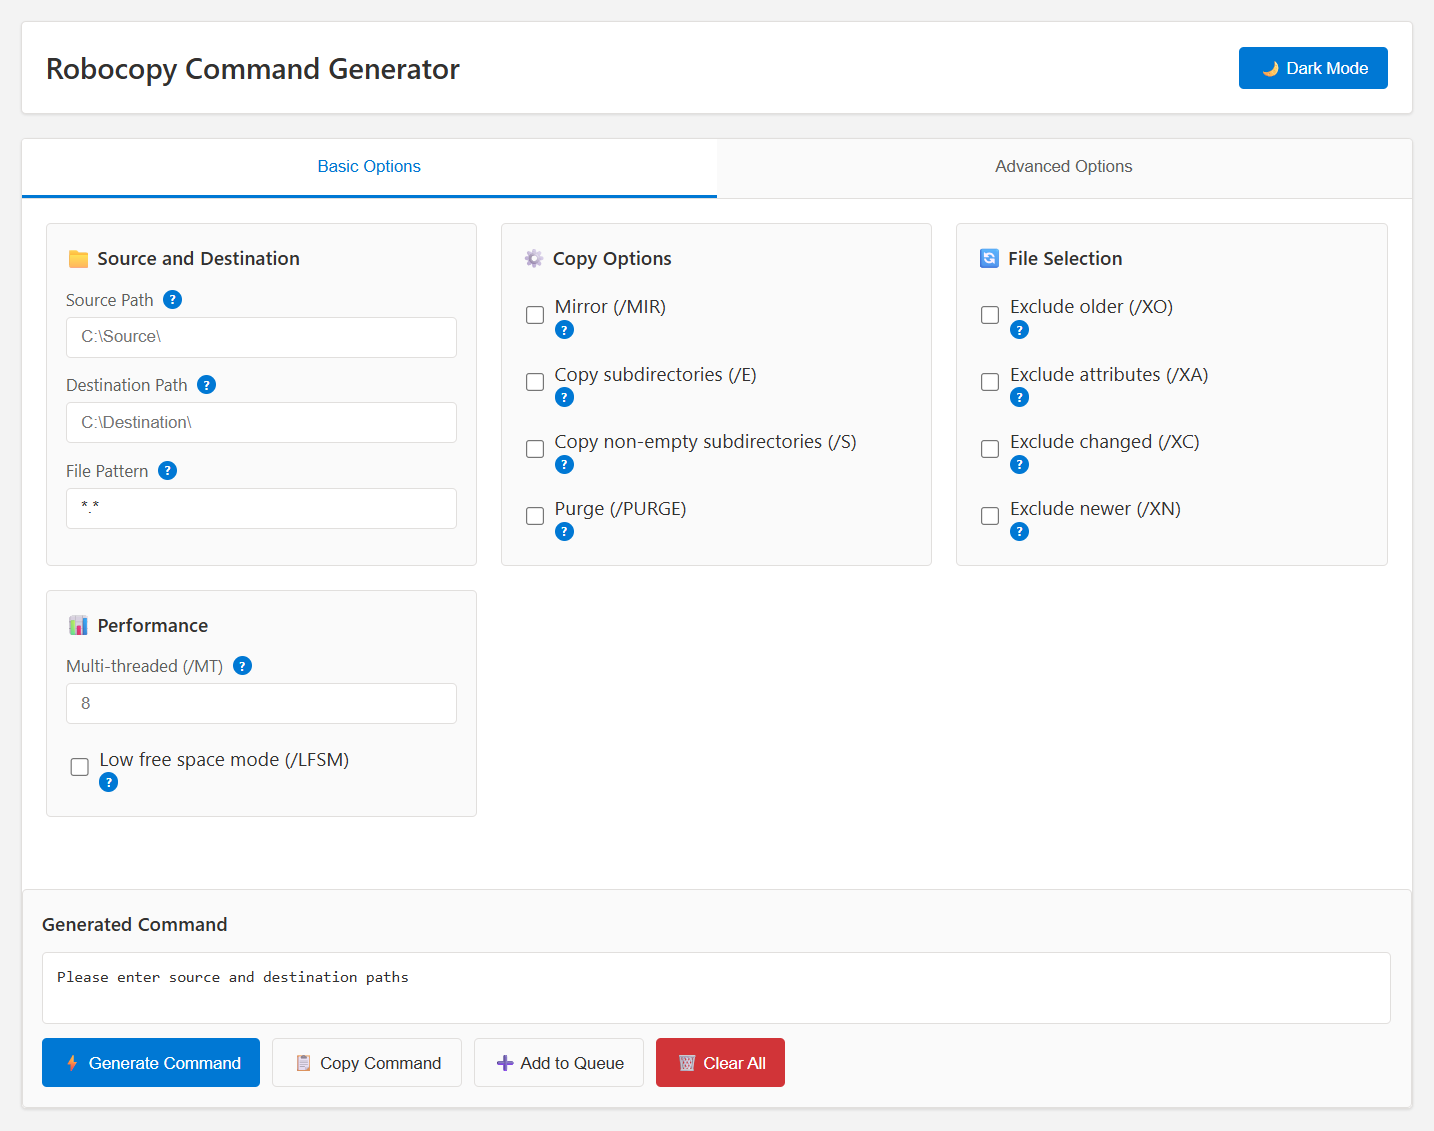
WgetGUI Ultimate: A Fluent Command Generator
Tools
Utilities
Web Development
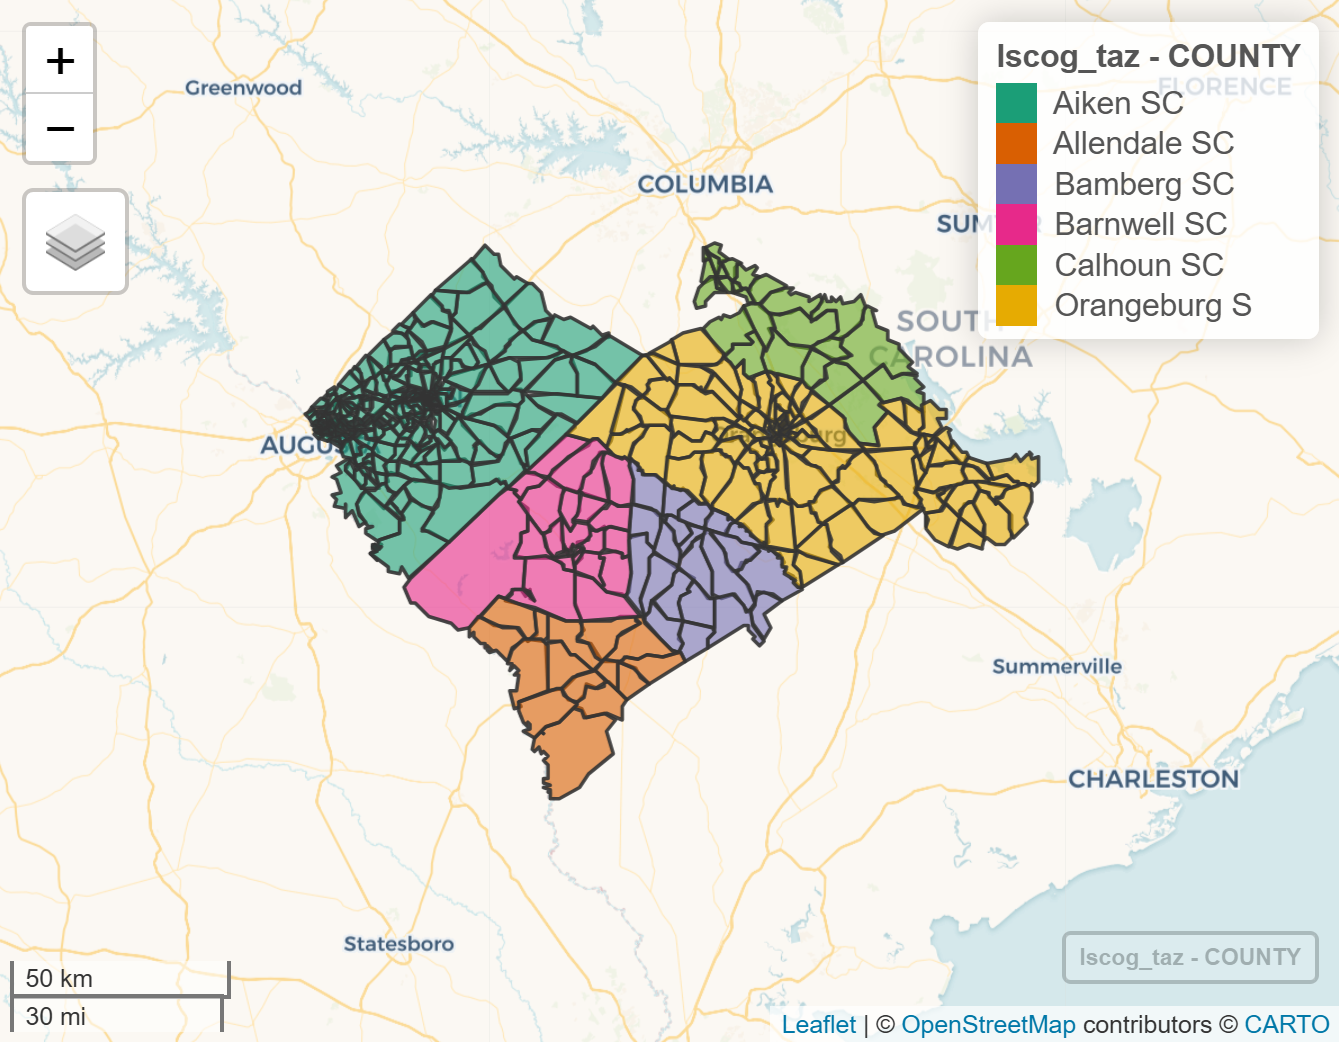
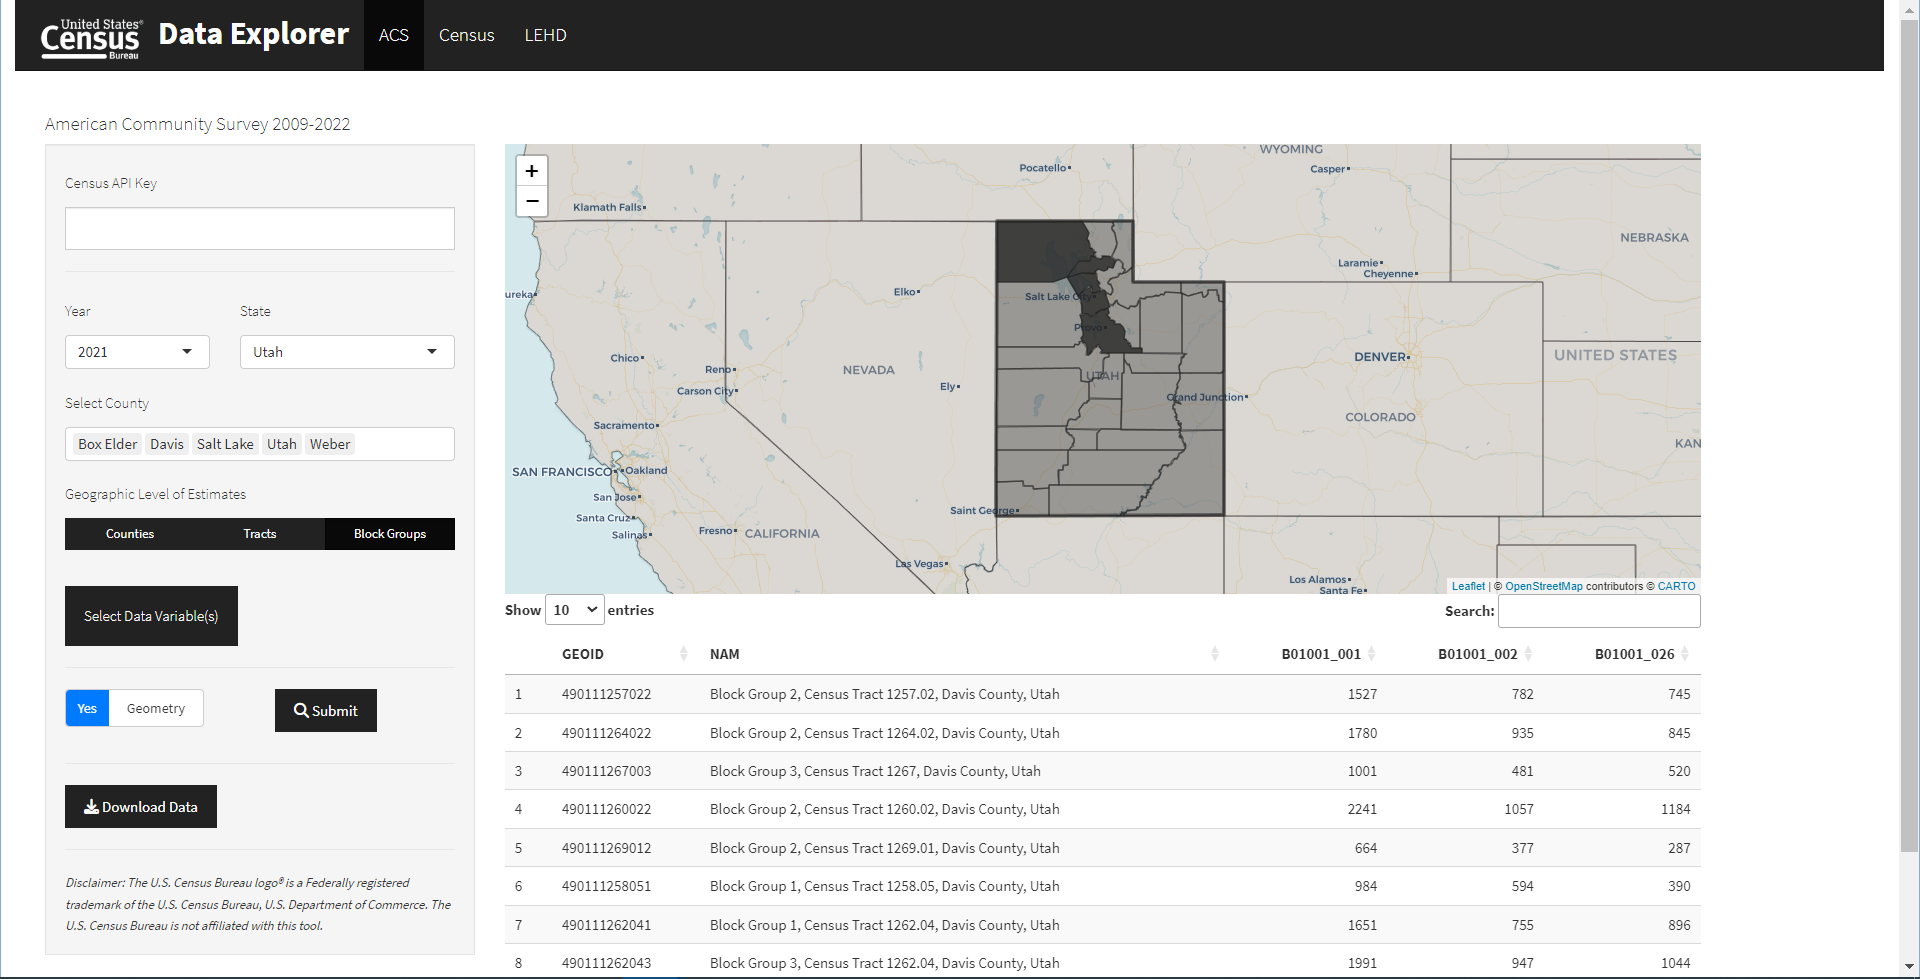
Base Year SE Data Development
R
Python
GIS
Data Science
Transportation
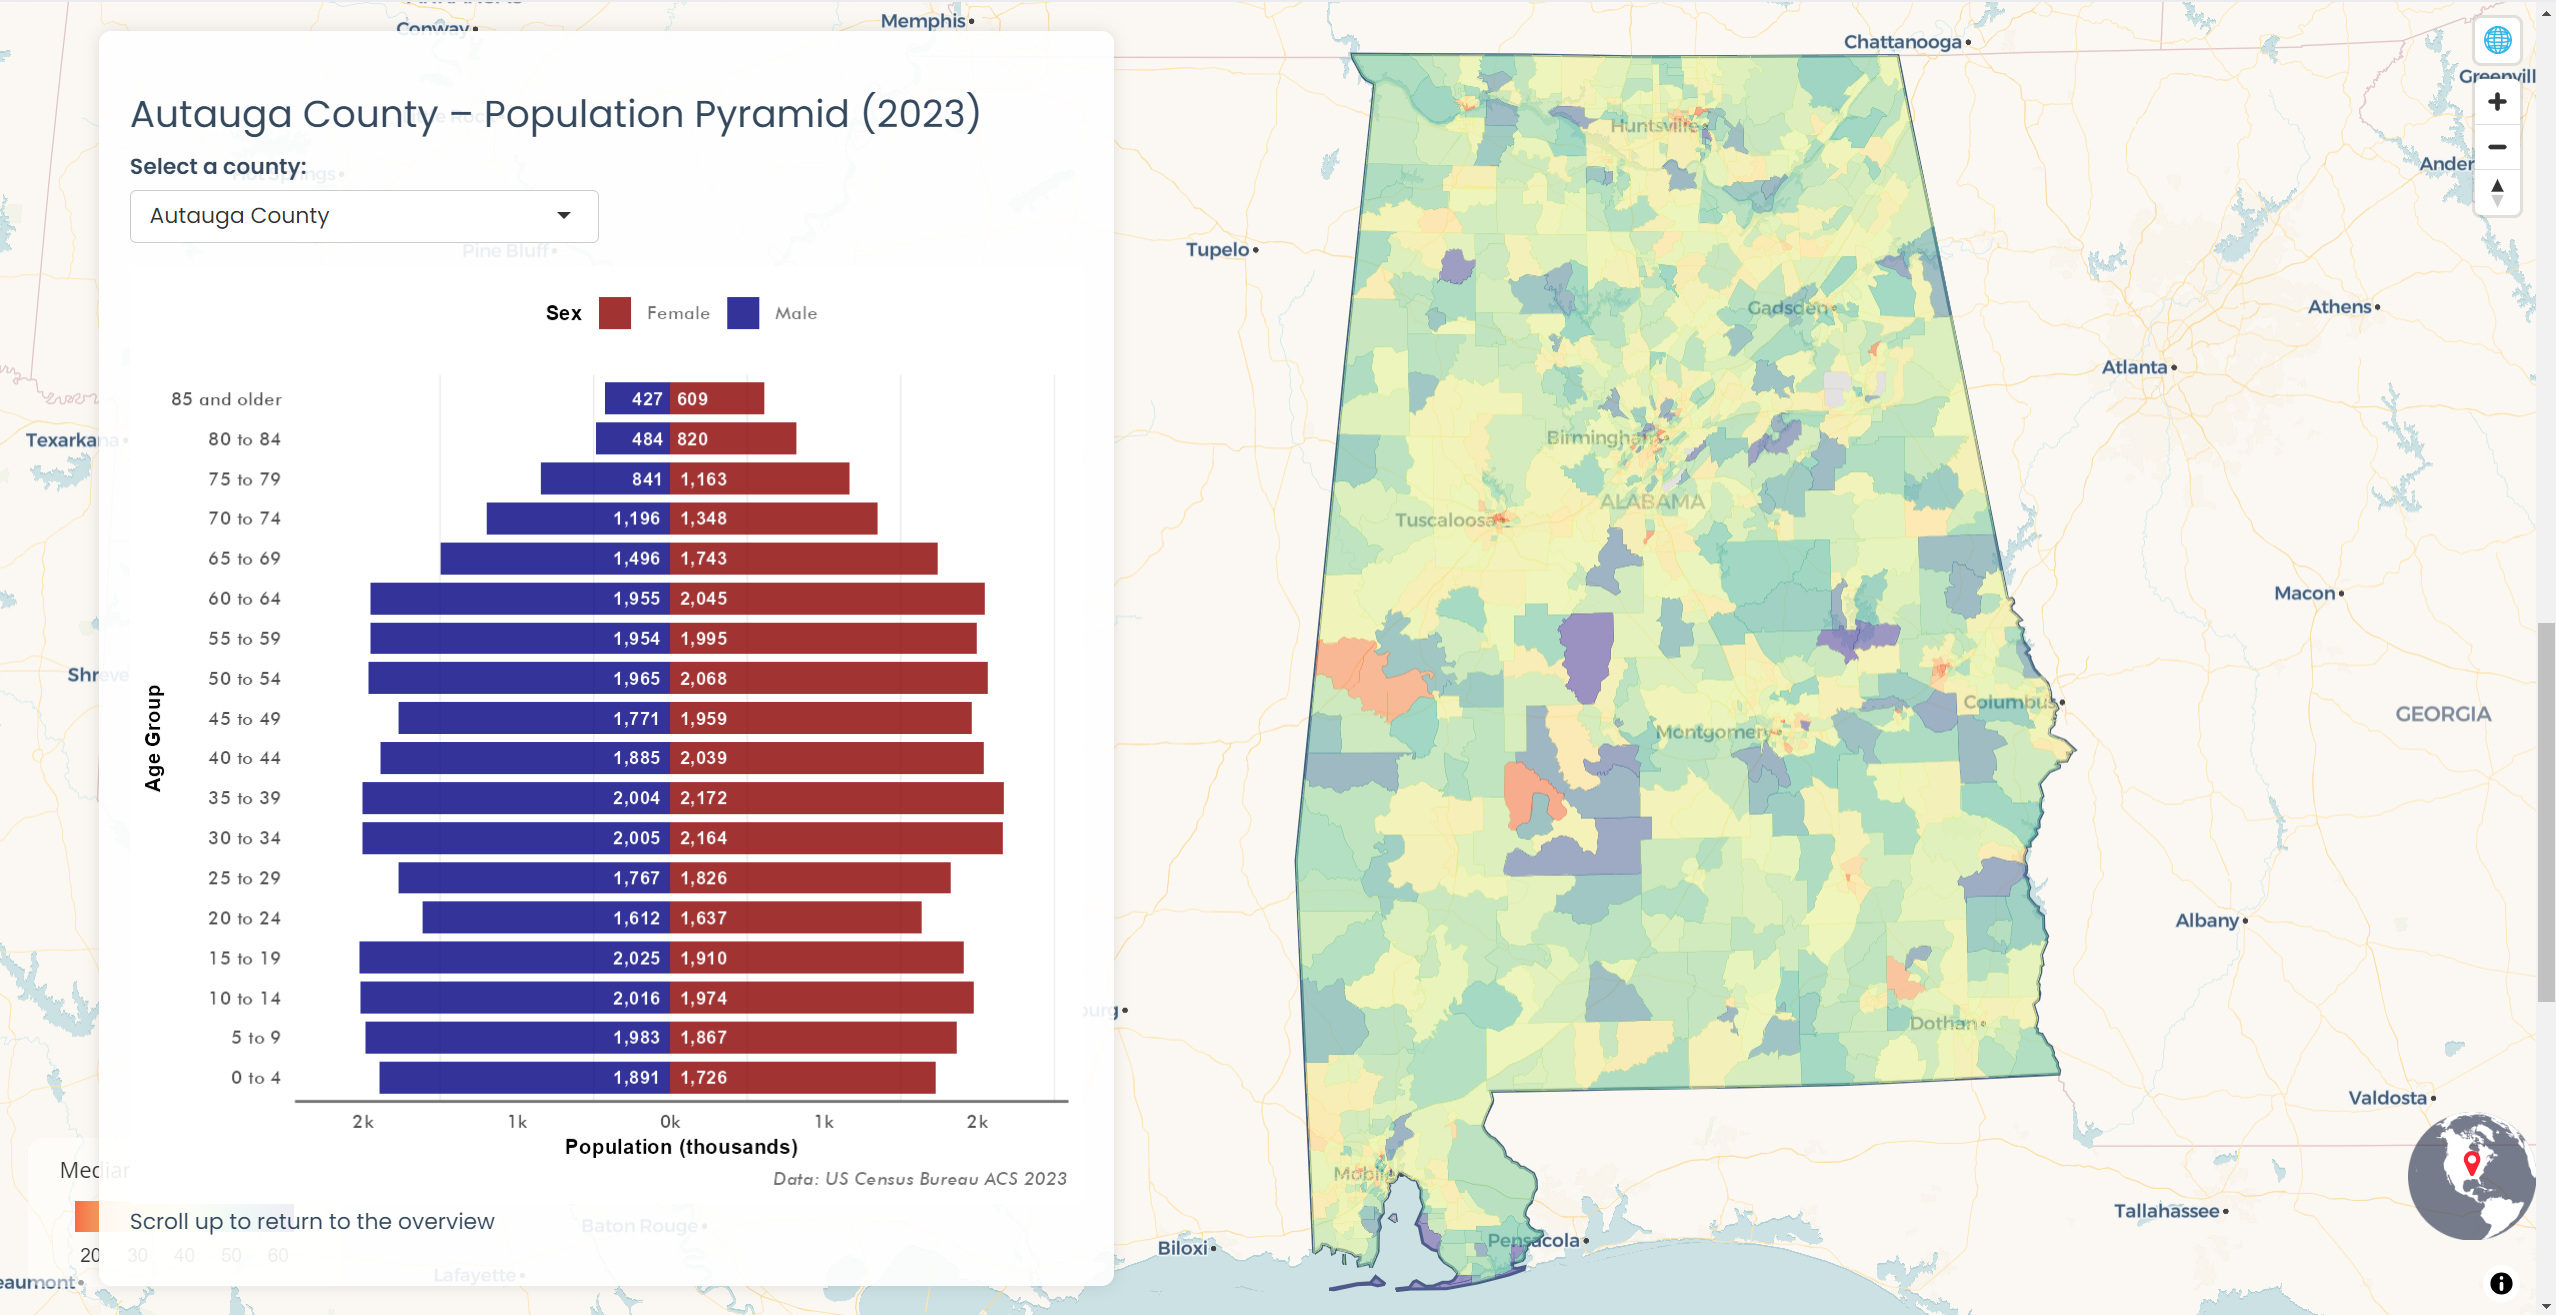
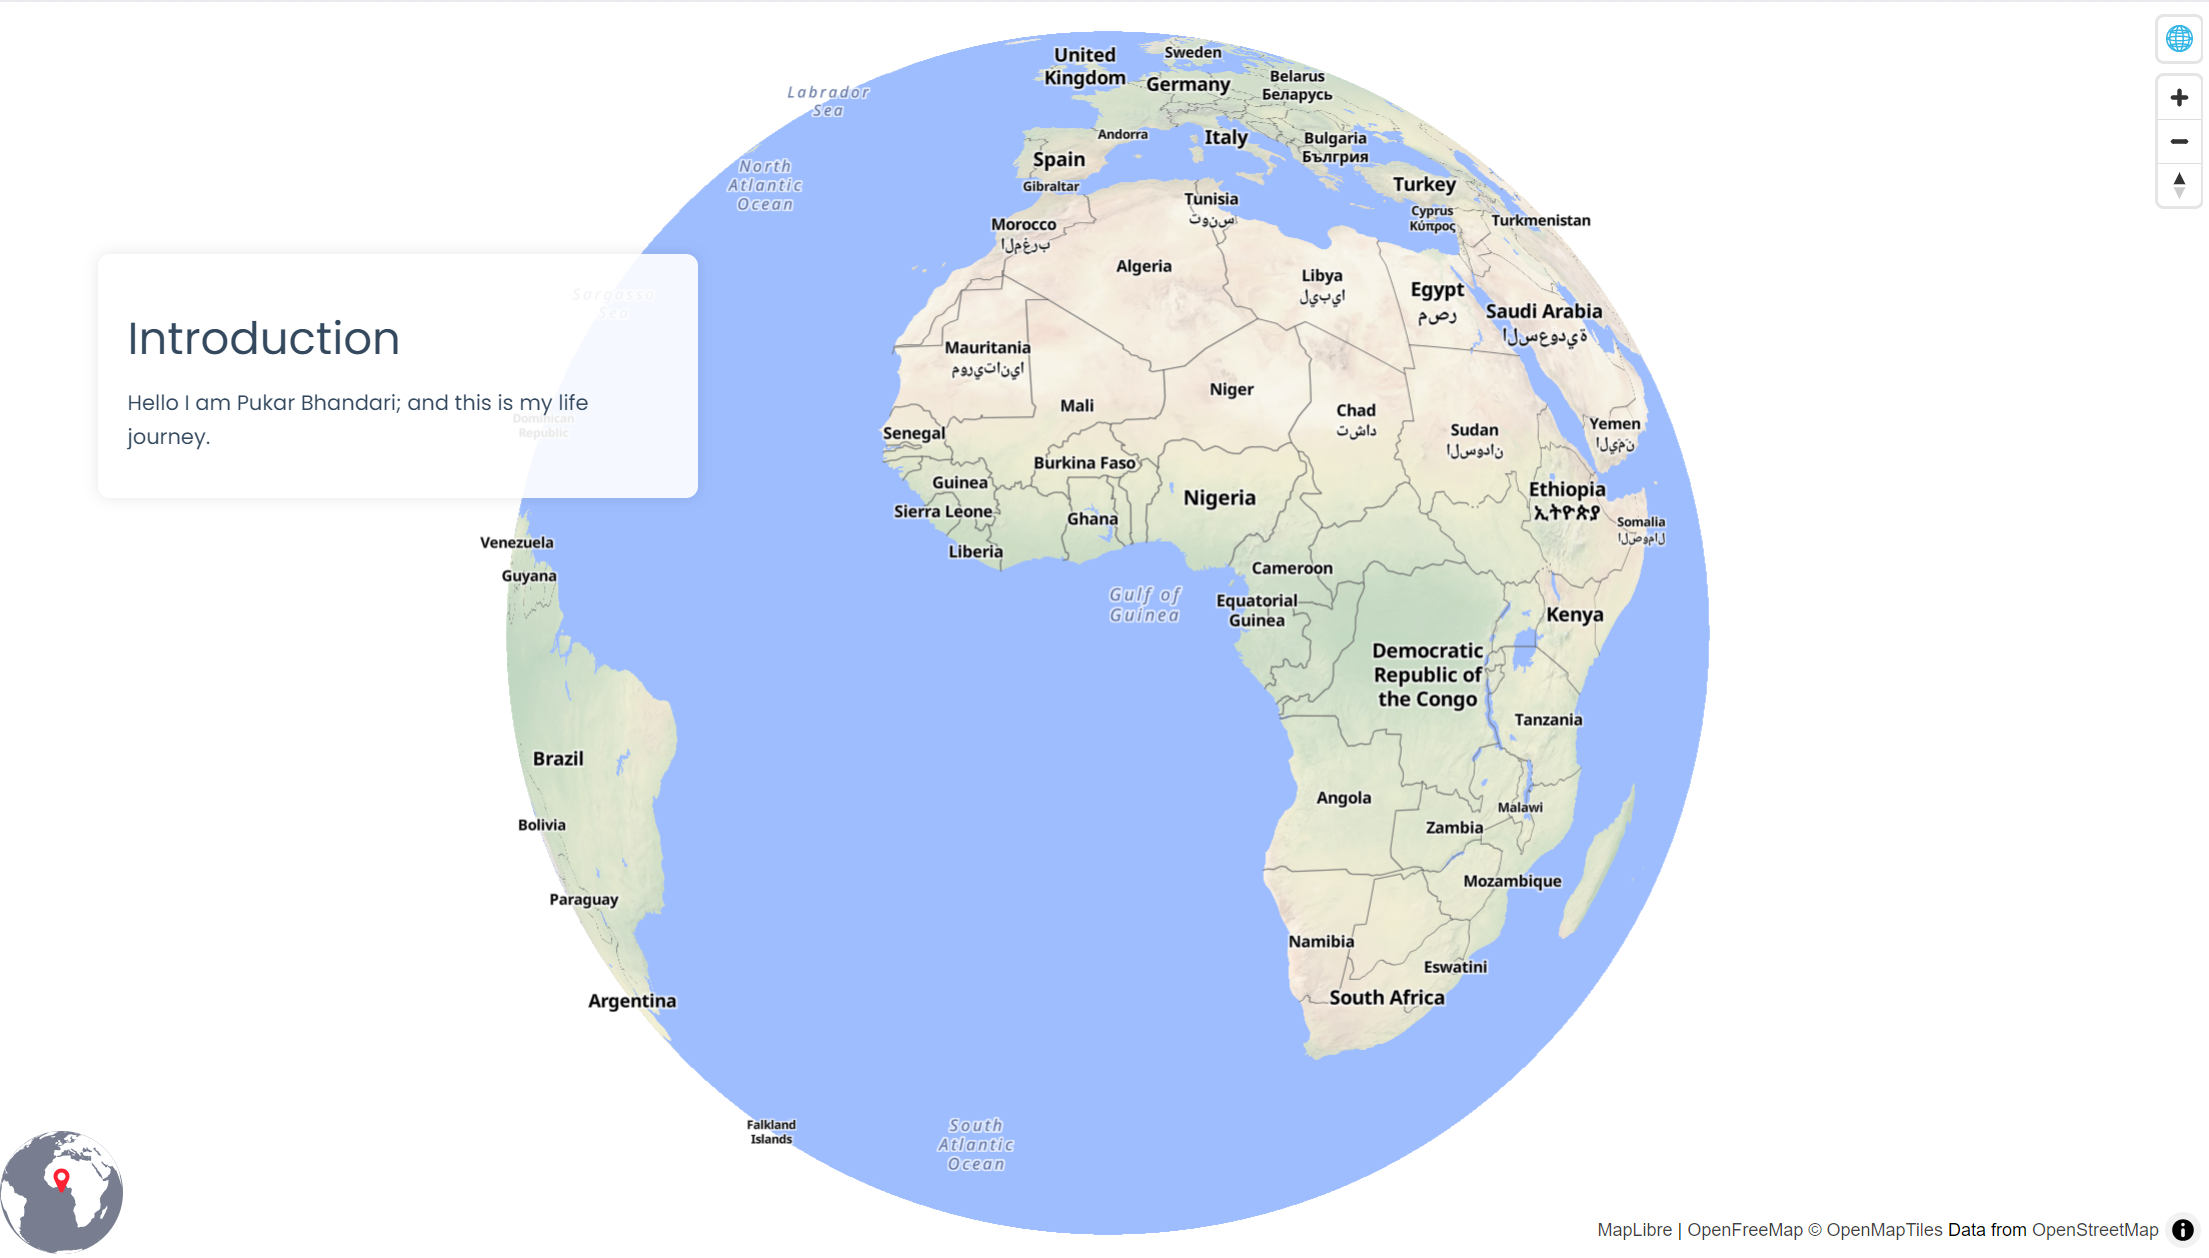
Building an Interactive Population Pyramid Explorer
R
Shiny
GIS
Census Data
Dashboard

No matching items