Developed at the Wasatch Front Regional Council (WFRC). The tool and its repository belong to WFRC; this page only summarizes my work.
What it does
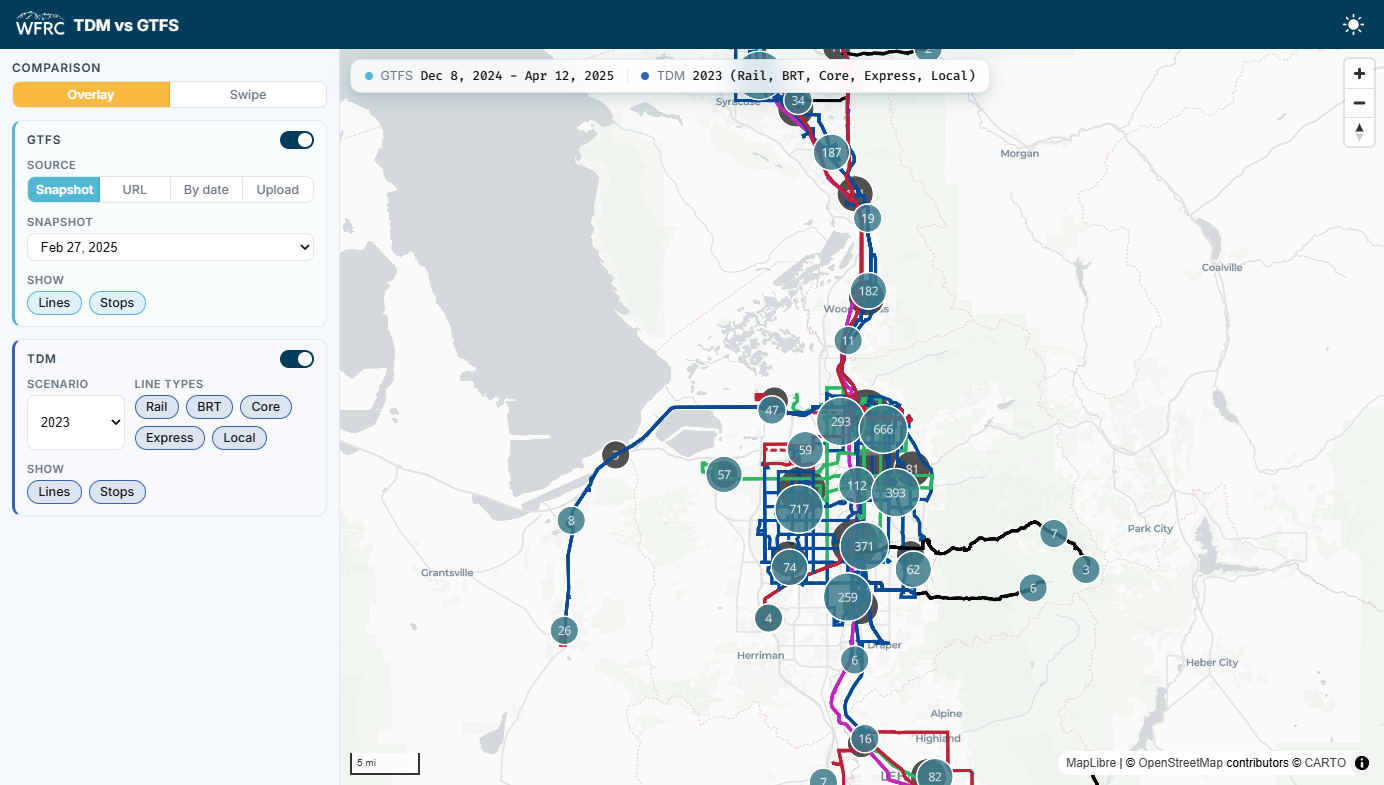
The regional travel demand model (TDM) represents transit service, meaning routes, stops and the line-haul network, for a defined base year. GTFS feeds describe the same service as it was actually operated. This tool puts both on one map so the two can be checked against each other.
It is deliberately a visual validation tool: there is no automated route matching or coverage-gap scoring. A person looks at the alignment and decides.
- Overlay or swipe: draw both networks on one map, or compare them side by side with a swipe control.
- Flexible GTFS sources: a saved snapshot, a feed URL, a calendar date resolved to the historical UTA snapshot closest to it, or an uploaded GTFS zip.
- TDM options: the base year or forecast scenarios, and line types (rail, BRT, core, express, local), each shown as lines, stops or both.
- Basemaps that follow light and dark mode.
What I worked on
The comparison app and the pipeline that turns GTFS feeds into route shapes and stops, including colors derived from each route’s own color.
My role: developer. I authored all the commits in the repository.