Developed at the Wasatch Front Regional Council (WFRC). The application and its repository belong to WFRC; this page only summarizes my work.
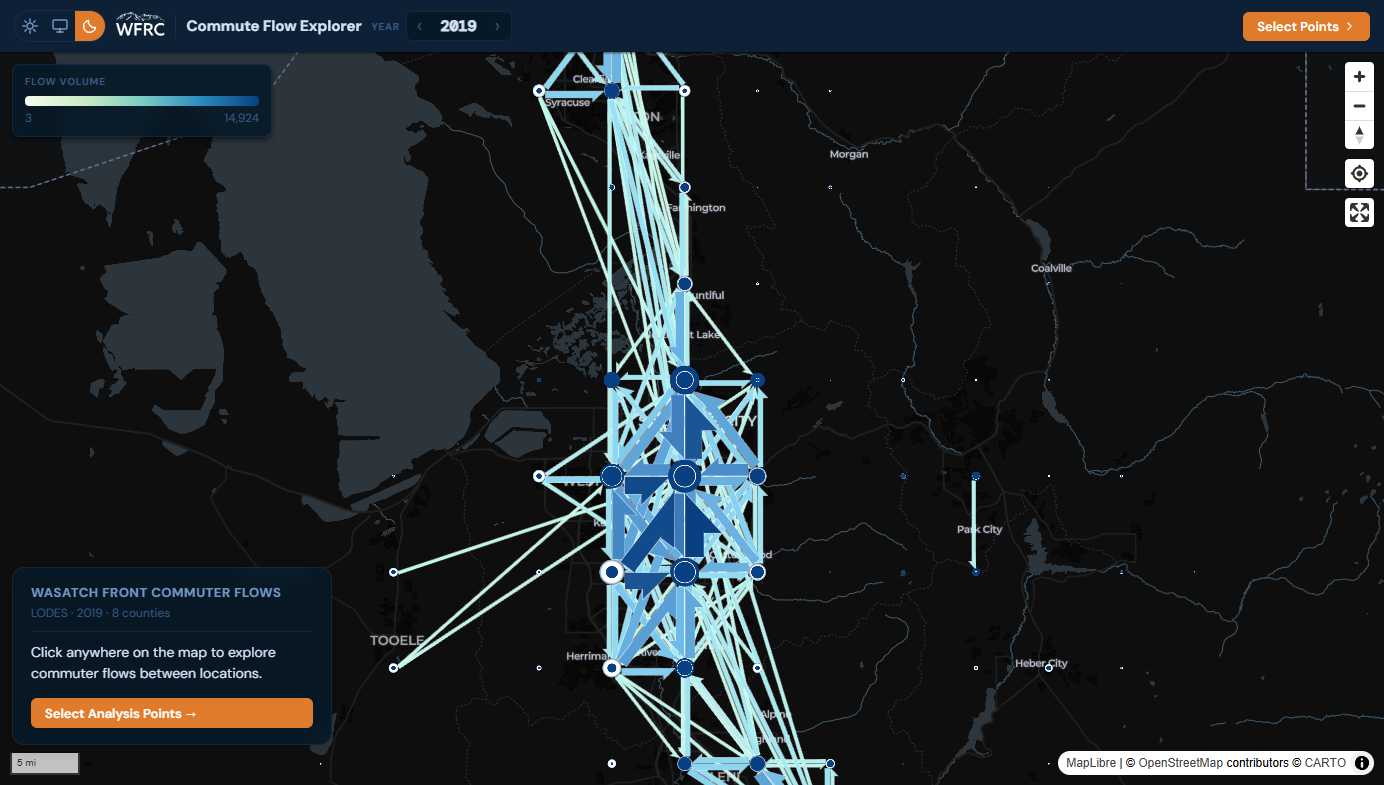
What it does
Where Commute Patterns answers questions about named jurisdictions, this app answers site-specific ones: click anywhere on the map to place 2 to 10 analysis points, each capturing a ring of H3 hexagons (about 0.1 km² cells), and compare the commute flows between them.
- An overview flow map of the whole eight-county region that disaggregates as you zoom in.
- An OD matrix with wage and industry breakdowns for every origin-destination pair.
- LEHD LODES data for 2002 to 2023, queried entirely in the browser with DuckDB-WASM, with light and dark themes.
Rule of thumb from the repository: use Commute Patterns for a named city, county or district, and use Commute Flow Explorer to draw your own catchment areas, such as a transit station or an employment center, and compare them.
What I worked on
The full application: a React and Vite front end, MapLibre with flowmap.gl and deck.gl for the flow layer, and the Parquet data that DuckDB-WASM queries.
My role: developer. I authored all the commits in the repository.